Key Points
-
Investors often study historical data to determine what comes next.
-
The market hasn’t looked this expensive since the turn of the century.
-
It’s good to study history, but doing so can never fully predict the future.
-
As we enter year five of a bull market, investors have gotten pretty anxious.
Look at trading activity since the midterm elections. Stocks had their best day in a year and a half on Nov. 4, only to give it all back the following day. It’s just a difficult environment for investors to analyze.
Missed AI’s “Act 1”? Act 2 Could Be 15x Bigger. Most investors think they missed the AI boat because they didn’t buy Nvidia in 2005. But according to our analysts, we’re only at the end of “Act 1″—the R&D phase. “Act 2” is the global rollout. Continue »
Earnings growth has been great all year long, driving the market higher, but there’s no telling what the future holds for artificial intelligence or what inning we are in of what many have called a super cycle or the fourth industrial revolution.
We’re witnessing the stock market do something for only the second time in the last 136 years, and history is clear about what’s next for stocks.
The market trades at worryingly high levels
After a roughly 4% pullback over the past month, the broader benchmark S&P 500 (SNPINDEX: ^GSPC) index is still up 10% this year. It’s coming off three consecutive years in which it rose at least 15%, and two of those years saw increases of over 20%.
Meanwhile, the market has held up remarkably well, despite the Iran war, which has kept inflation high and driven gas prices over $4.50 per gallon at some points this year. Strong corporate earnings growth this year, expected to be nearly 33% according to FactSet, has kept the market afloat.
Still, the market remains at worrying levels, based on a closely watched metric called the cyclically adjusted price-to-earnings (CAPE) ratio, also known as the Shiller P/E.
This ratio divides the S&P 500’s market cap by its 10-year inflation-adjusted earnings. The purpose of this is to smooth out irregularities commonly seen in the business cycle.
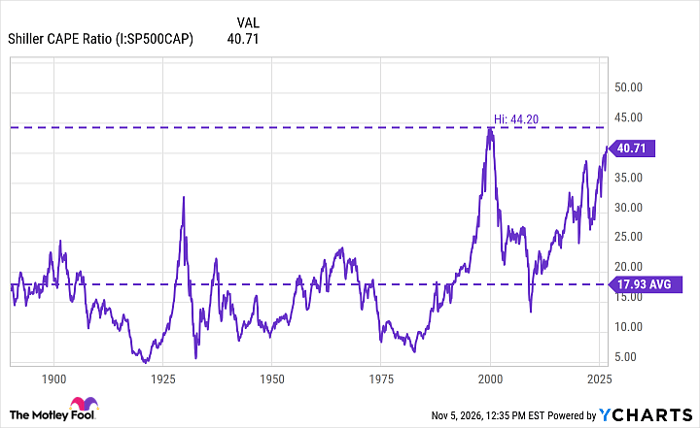
Shiller CAPE Ratio data by YCharts
The Shiller P/E is now close to 41, which is more than double the average dating back to 1890. Furthermore, the ratio has been this high only once in the market’s history, which is precisely what worries many investors.
The one time the Shiller P/E surpassed current levels was in the year 2000, when it rose above 44.
This is the year the dot-com bubble burst when internet stocks got way too frothy. Starting in 2000, tech stocks would get absolutely crushed, with the tech-heavy Nasdaq Composite losing roughly 77% of its value over the next two years.
Investors may recall that the five years preceding the bursting of the dot-com bubble were a period of spectacular gains that the market has rarely matched in history.
What happens next?
The market is keenly aware of what the Shiller P/E is saying, and investors have been extremely jittery this year, with the large AI hyperscalers experiencing big sell-offs on numerous occasions this year, although often rebounding.
It’s important to note that while there are many similarities, there are also distinct differences between the dot-com bubble and the AI supercycle. For instance, the large and profitable hyperscalers have funded the AI infrastructure build-out.
But as hyperscalers have invested more and taken on more debt to build out data centers, several have now dipped into negative free cash flow, worrying investors. If AI doesn’t pan out as expected or suffers a major setback, these stocks could get hammered.
Ultimately, when looking at the Shiller P/E, history is clear that a major reset is coming.
And I do think we will see a real bear market at some point. The problem is that timing the market is nearly impossible. After all, earnings growth is still projected to be strong, and history shows that stocks perform extremely well in the year following midterms. Is it 1997 or 2000?
Who knows, but investors should be prepared for anything. That means reviewing everything in your portfolio, checking your stocks’ valuations, and assessing their ability to survive a bear market.
Many long-term investors likely don’t need to make big changes. But at the very least, investors should be prepared so they don’t get caught flat-footed and make foolish decisions like panic selling.
Should you buy stock in S&P 500 Index right now?
Before you buy stock in S&P 500 Index, consider this:
The Motley Fool Stock Advisor analyst team just identified what they believe are the 10 best stocks for investors to buy now… and S&P 500 Index wasn’t one of them. The 10 stocks that made the cut could produce monster returns in the coming years.
Consider when Netflix made this list on December 17, 2004… if you invested $1,000 at the time of our recommendation, you’d have $341,966!* Or when Nvidia made this list on April 15, 2005… if you invested $1,000 at the time of our recommendation, you’d have $1,146,819!*
Now, it’s worth noting Stock Advisor’s total average return is 852% — a market-crushing outperformance compared to 203% for the S&P 500. Don’t miss the latest top 10 list, available with Stock Advisor, and join an investing community built by individual investors for individual investors.
See the 10 stocks »
*Stock Advisor returns as of November 9, 2026.
Bram Berkowitz has no position in any of the stocks mentioned. The Motley Fool has no position in any of the stocks mentioned. The Motley Fool has a disclosure policy.