Key Points
-
The Shiller P/E hovers around 40, more than twice its historical average.
-
Five previous periods of similarly high valuations ended with significant market declines.
-
High valuations might be a signal of disappointing returns rather than an imminent market crash.
-
History doesn’t repeat itself exactly, but sometimes it comes pretty close. And right now, one of the stock market’s most reliable valuation tools is flashing a warning seen only six times since 1871.
The warning comes from the Shiller price-to-earnings (P/E) ratio, one of our most time-honored valuation tools. This handy metric divides the current price of the S&P 500 (SNPINDEX:^GSPC) by its average inflation-adjusted earnings from the previous 10 years, helping us gauge how expensive stocks are. Over 156 years, the Shiller P/E has averaged nearly 18. Only six times has the metric crossed a threshold of 30; in five of the last six, it was followed by a significant market decline.
Missed AI’s “Act 1”? Act 2 Could Be 15x Bigger. Most investors think they missed the AI boat because they didn’t buy Nvidia in 2005. But according to our analysts, we’re only at the end of “Act 1″—the R&D phase. “Act 2” is the global rollout. Continue »
Today, the Shiller P/E clocks in at around 40. On the surface, that seems concerning for investors. But there might be a catch to this seemingly ominous warning, and it might change how we interpret what history is signaling to us.
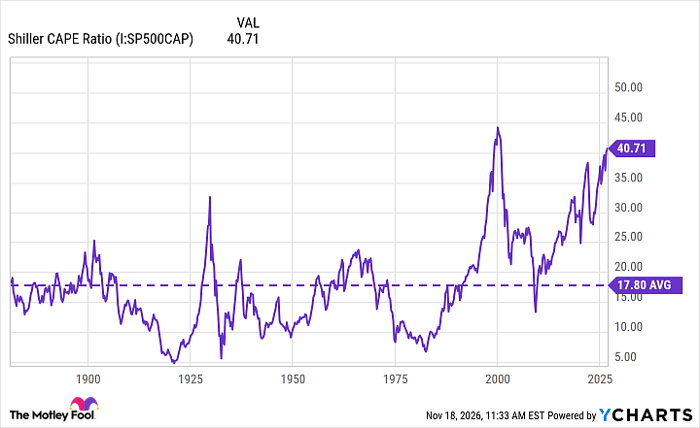
Shiller CAPE Ratio data by YCharts
What history makes clear about the past
First, let’s start with the historical record. Fair warning: It’s not particularly encouraging.
The five previous periods in which the Shiller P/E rose above 30 for two consecutive months during a bull market did not end well for investors. That’s an euphemism. It ended badly, very badly. One only has to mention the crash of 1929, or the bursting of the dot-com bubble in 2000, or the COVID-19 crash of 2020, to get a mental picture of the damage. The S&P 500 also dropped nearly 20% in late 2018 and roughly 25% during the 2022 bear market.
From this perspective, the Shiller P/E looks like a crystal ball. Jump above 30, so it goes, and a market crash will follow. But there’s a problem with this interpretation, and it could be making the Shiller P/E look far better at predicting crashes than it actually is.
Image source: Getty Images.
The problem could be that we’re looking at these six occurrences separately when at least four could be considered as one extended period of unusually expensive stocks. This is the argument of former Federal Reserve economist William Emmons, who has pointed out that the Shiller P/E hasn’t fallen below 24 since October 2013.
Why would this matter? Simply put, it means we have fewer truly independent examples of the Shiller P/E predicting a market crash. Instead of six separate warnings, we might be looking at just three periods of extremely high valuations, with the third still ongoing. That doesn’t change the fact that market crashes occurred. But counting each episode separately could make the Shiller P/E look more reliable at predicting crashes than it actually is.
That said, Emmons doesn’t discredit or dismiss the Shiller P/E. He thinks it’s a valuable metric. But its real value, he suggests, doesn’t lie in predicting market crashes; rather, it helps investors understand the long-term returns stocks might deliver over the next decade. And when valuations are unusually high, Emmons argues, those returns are historically disappointing. Which brings me to my next point.
What history might be telling us today
Again, it’s easy to look at the history of the Shiller, and assume that a market crash will end this period of unusually expensive stocks. But a stock market crash isn’t the only way high valuations could level out. Indeed, stocks could simply go nowhere for years while earnings remain strong, and a similar result would occur.
Here’s what I mean. Let’s say that the Shiller P/E drops from 40 to 30. Well, that could mean stock prices dropped 25%, assuming average inflation-adjusted earnings stayed the same. But it could also mean that stock prices stayed relatively flat while earnings increased by a third or more. These are totally different investing experiences — a market crash versus years of stagnant returns — but either way, the market comes out looking less expensive.
In this way, the warning from history isn’t that stocks are about to plunge even more than they have recently. They might, they might not. Either way, it’s a good reminder to pause, take a hard look at our investments, and reassess how much risk we’re taking. After all, the stock market could avoid a crash, corporate profits could continue growing, and investors could still earn disappointing returns. That might sound paradoxical, but at today’s valuation it is entirely possible.
Should you buy stock in S&P 500 Index right now?
Before you buy stock in S&P 500 Index, consider this:
The Motley Fool Stock Advisor analyst team just identified what they believe are the 10 best stocks for investors to buy now… and S&P 500 Index wasn’t one of them. The 10 stocks that made the cut could produce monster returns in the coming years.
Consider when Netflix made this list on December 17, 2004… if you invested $1,000 at the time of our recommendation, you’d have $315,271!* Or when Nvidia made this list on April 15, 2005… if you invested $1,000 at the time of our recommendation, you’d have $896,981!*
Now, it’s worth noting Stock Advisor’s total average return is 768% — a market-crushing outperformance compared to 198% for the S&P 500. Don’t miss the latest top 10 list, available with Stock Advisor, and join an investing community built by individual investors for individual investors.
See the 10 stocks »
*Stock Advisor returns as of November 20, 2026.
Steven Porrello has no position in any of the stocks mentioned. The Motley Fool has no position in any of the stocks mentioned. The Motley Fool has a disclosure policy.