Key Points
-
The Shiller CAPE ratio measures stock market valuations over a long-term time horizon.
-
Historically speaking, readings of 40 or above signal unusually high valuations.
-
While the stock market may be headed for a correction, smart investors can still come out ahead.
-
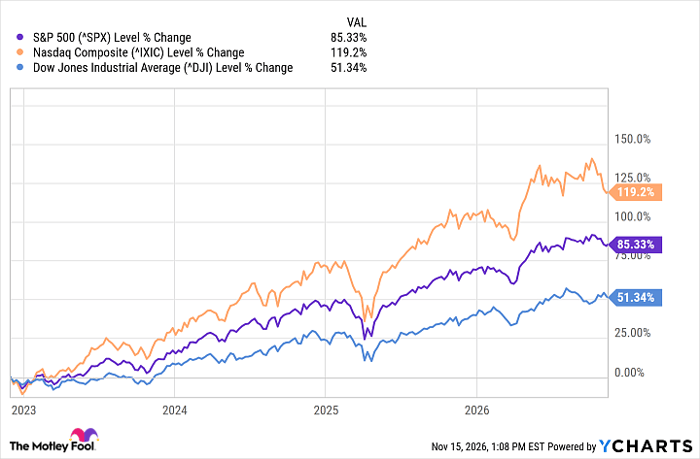
Since OpenAI launched ChatGPT to the public in late November 2022, the stock market has enjoyed a pretty epic rally fueled by enthusiasm surrounding artificial intelligence (AI). Over the last four years, the S&P 500 (SNPINDEX:^GSPC) has gained 85%, while the Nasdaq Composite (NASDAQINDEX:^IXIC) has surged 119%. Even the Dow Jones Industrial Average (DJINDICES:^DJI) has advanced by 51%, illustrating how the bull market has extended beyond technology stocks.
^SPX data by YCharts
Missed AI’s “Act 1”? Act 2 Could Be 15x Bigger. Most investors think they missed the AI boat because they didn’t buy Nvidia in 2005. But according to our analysts, we’re only at the end of “Act 1″—the R&D phase. “Act 2” is the global rollout. Continue »
The AI revolution has propelled stock market valuations to historically elevated levels, raising concerns that investors may be witnessing another bubble. One useful valuation tool suggests investors have good reason to be cautious right now, although its history also demonstrates why attempting to time the market is often a costly mistake.
The stock market is historically expensive, according to the CAPE ratio
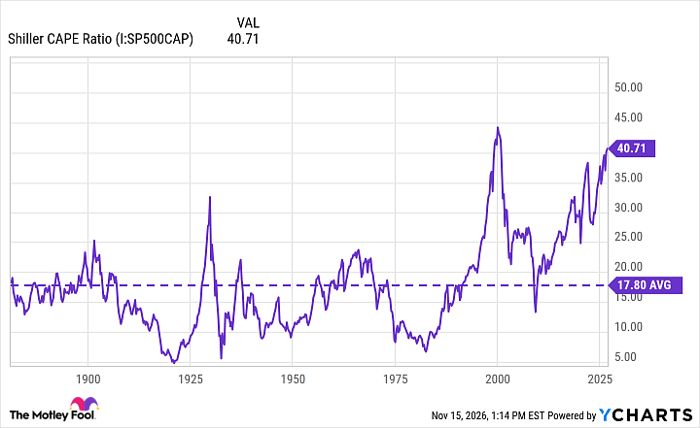
Developed by economist Robert Shiller, the cyclically adjusted price-to-earnings (CAPE) ratio compares the S&P 500’s price with its average inflation-adjusted earnings over the last 10 years. Unlike the price-to-earnings (P/E) ratio, which measures a company using one year of historical or projected profits, the CAPE ratio smooths out fluctuations in earnings across economic cycles. This makes it useful for evaluating whether the broader stock market is expensive or reasonably valued relative to historical levels.
Historically, the CAPE ratio has averaged approximately 18. However, recent readings have sustained above 40. Such elevated valuations can make stocks vulnerable to disappointing earnings, rising interest rates, or shifts in investor sentiment.
Shiller CAPE Ratio data by YCharts
What happened the other times the CAPE ratio approached 40?
An elevated CAPE ratio doesn’t automatically mean a stock market crash is imminent. To understand why investors shouldn’t use the CAPE ratio as a market-timing tool, it’s worth examining three historical periods when valuations approached or exceeded 40.
- The dot-com boom (1999–2000): The CAPE ratio exceeded 40 in January 1999 and remained above that threshold through September 2000, reaching an all-time high of 44.2 in December 1999. Despite these unusually high valuations, the S&P 500 actually continued to soar until March 24, 2000, when it closed at 1,527. The subsequent collapse in speculative technology stocks triggered a bear market, ultimately sending the broader index down 49% by Oct. 9, 2002.
- The COVID-19 pandemic (2021–2022): Following a short-lived crash in February 2020, a combination of low interest rates, aggressive monetary stimulus, and enthusiasm for growth stocks fueled an unprecedented stock market rebound. The CAPE ratio briefly touched 38.6 in November 2021 and then eclipsed the 40 threshold by January 2022. The S&P 500 peaked around 4,796 on Jan. 3, 2022, before falling roughly 25% by October as inflation accelerated and the Federal Reserve raised interest rates.
- The AI revolution (2025–2026): The latest period of stretched valuation began developing throughout 2025 as investors rewarded companies benefiting from AI infrastructure spending. The CAPE ratio reached 39.6 in December 2025 before exceeding 40 in May 2026, remaining above that level as of this writing. Unlike the previous two episodes, the current cycle is unresolved, meaning stocks could continue climbing, experience a correction, or enter a prolonged bear market.
These three episodes illustrate why the CAPE ratio is more useful for assessing long-term investment risk than predicting short-term market fluctuations. Investors who sold simply because valuations became historically expensive in early 1999 would have actually missed additional gains before the dot-com bubble eventually burst. Similarly, today’s elevated valuations don’t necessarily establish when the next downturn will inevitably begin or how severe it could become.
Image source: Getty Images.
You can still come out ahead if you buy expensive stocks
Although the historical evidence suggests the market could be headed for disappointing returns, it also offers an encouraging lesson for investors with a long-term time horizon.
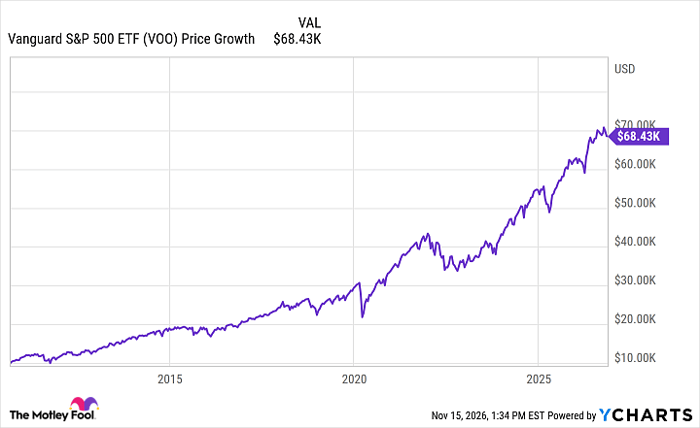
Consider someone who invested $10,000 in an S&P 500 index fund on March 24, 2000, right before the dot-com collapse. Despite experiencing multiple bear markets and recessions over the following decades, that investment would have grown to approximately $68,400 by Nov. 13.
VOO data by YCharts
Someone who invested $10,000 at the S&P 500’s peak on Jan. 3, 2022 would have first endured a 25% decline over the following nine months. However, the investment would eventually have recovered and grown to about $15,800 if they had held through today.
Although the CAPE ratio has approached or exceeded 40 during periods of stock market euphoria, it has never reliably provided a timetable for the next correction or bear market. Investors who maintain diversified portfolios, avoid chasing momentum, and remain invested through volatility over the long term have always benefited from the stock market’s resiliency.
Should you buy stock in S&P 500 Index right now?
Before you buy stock in S&P 500 Index, consider this:
The Motley Fool Stock Advisor analyst team just identified what they believe are the 10 best stocks for investors to buy now… and S&P 500 Index wasn’t one of them. The 10 stocks that made the cut could produce monster returns in the coming years.
Consider when Netflix made this list on December 17, 2004… if you invested $1,000 at the time of our recommendation, you’d have $335,171!* Or when Nvidia made this list on April 15, 2005… if you invested $1,000 at the time of our recommendation, you’d have $1,000,640!*
Now, it’s worth noting Stock Advisor’s total average return is 823% — a market-crushing outperformance compared to 208% for the S&P 500. Don’t miss the latest top 10 list, available with Stock Advisor, and join an investing community built by individual investors for individual investors.
See the 10 stocks »
*Stock Advisor returns as of November 17, 2026.
Adam Spatacco has no position in any of the stocks mentioned. The Motley Fool has no position in any of the stocks mentioned. The Motley Fool has a disclosure policy.