Key Points
-
The U.S. labor market looks frozen, with jobless claims hovering near record lows but job growth stagnant.
-
Historically, bear markets and recessions correlate highly with rising jobless claims.
-
That would suggest no imminent recession risk, but the AI economy could change the current outlook.
-
In mid-July, new jobless claims dropped to 189,000 in a single week, the lowest reading since 1969. In mid-October, that figure is up only slightly to 194,000, so there’s still a historically low number of people claiming jobless benefits.
But there’s a flip side to this. In September, employers only added 29,000 jobs, bringing the 12-month rolling average to an only modestly higher 45,000. In other words, almost nobody is being laid off. But almost no one is getting hired either.
Missed Nvidia in 2009? This Rare Signal Is Flashing Again. In 2009, a “Double Down” signal flashed for a little-known chipmaker called Nvidia. For the first time in years, that same “Total Conviction” signal is flashing for a company 1/100th the size of Nvidia. Continue »
Is this a sign of strength or weakness? And what could it mean for stocks?
Low layoffs don’t equal strong hiring
Initial jobless claims count people who have just lost a job and applied for benefits. But they don’t say anything about the ability of those workers to land another one.
Strong earnings growth has likely reduced pressure for companies to cut headcount, and tighter immigration policies may be motivating them to keep the people they have as well. An unemployment rate of 4.2% (and one that has remained at or below 4.5% since 2021) suggests an economy that’s at full employment.
But the economy doesn’t appear to be adding jobs either. The most obvious culprit is the artificial intelligence (AI) boom. Companies may be hesitant to add employees if they’re 1) concerned that they might not see the return on investment (ROI) from AI capital expenditures they’ve already made, or 2) they feel that AI can handle a lot of the responsibilities that a person would have handled before.
What this suggests is a labor market that’s essentially frozen. It’s not expanding, but it’s not contracting either.
What this means for recession risk
Initial jobless claim figures tend to positively correlate with recessions. As claims spike higher, it significantly raises the risk that a recession is imminent. We’ve seen it in every recession since the 1970s.
With initial claims recently hitting 57-year lows, there’s no uptrend happening that would signal a recession is near.
Despite everything we hear about consumers being under strain due to affordability issues, high gas prices, and an inflation rate well above 3%, they still seem to be spending plenty of money. This tends to slow down as people lose their jobs or feel that they’re at risk of losing their jobs. This doesn’t seem to be happening either.
What this means for the S&P 500 and consumer stocks
Consumer stocks have unquestionably been one of the U.S. equity market’s weak spots in 2026. Consumer staples, which tend to enjoy steady demand, have roughly kept pace with the S&P 500 (SNPINDEX: ^GSPC). The consumer discretionary sector, which usually behaves more in line with economic conditions, is the second-worst-performing S&P 500 sector year to date with a return of -3%.
That’s a fairly reasonable reaction based on what we know about the economy today.
History shows pretty consistently that initial jobless claims and stock prices are inversely correlated. Here’s the chart of initial jobless claims from 1970-2020.
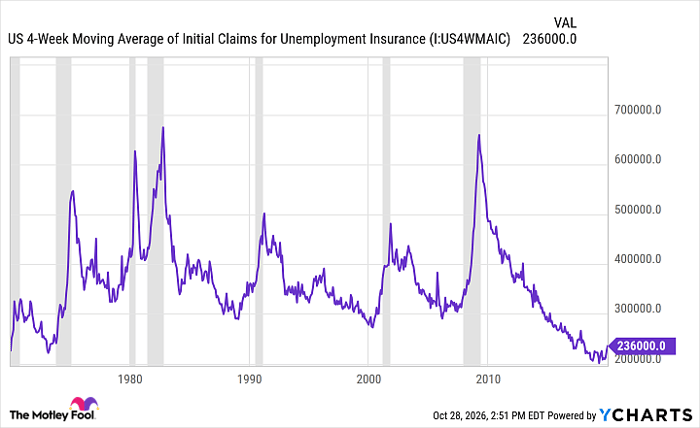
US 4-Week Moving Average of Initial Claims for Unemployment Insurance data by YCharts
And here’s the chart of how far the S&P 500 is from its all-time high.
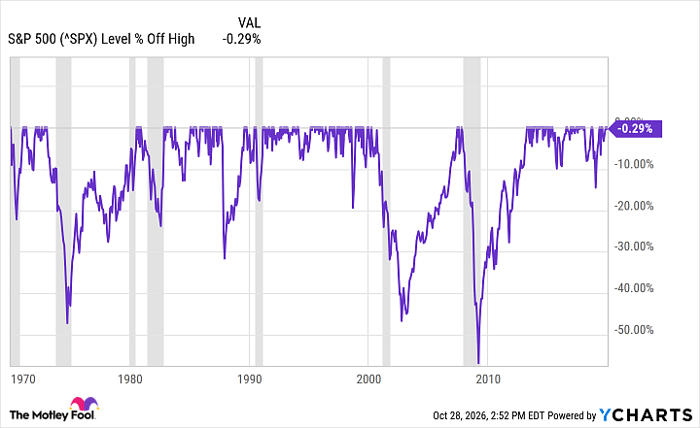
^SPX data by YCharts
The only real exceptions to the “claims up, stocks down” rule is the late 1980s, when initial jobless claims started moving steadily higher, but the S&P 500 was able to hang within about 8% of its highs. At least until the early 1990s recession.
The late 1970s, during the tail end of the ugly stagflationary period, could also be considered an anomaly, but stocks were already about 20% below their highs when claims started picking up.
But if you use the overall historical trends of jobless claims and the S&P 500, it would suggest that stock prices have some firm support as long as jobless claims remain low. Strong earnings growth in the background would help with the bullish backdrop.
How to use this information in your portfolio
The labor market doesn’t necessarily need to expand for stock prices to move higher (although it certainly helps). It needs it to not contract. As long as that happens, I believe there’s little headwind for stock prices using that metric in isolation.
But the AI economy is shifting quickly. Investors are growing increasingly suspicious of the value of AI capital expenditures (capex) spending, and any slowdown in earnings growth could result in a quick pullback for the S&P 500.
Long-term investors probably shouldn’t worry here. But they should be prepared if the bullish conditions of the past few years show signs of peaking.
Should you buy stock in S&P 500 Index right now?
Before you buy stock in S&P 500 Index, consider this:
The Motley Fool Stock Advisor analyst team just identified what they believe are the 10 best stocks for investors to buy now… and S&P 500 Index wasn’t one of them. The 10 stocks that made the cut could produce monster returns in the coming years.
Consider when Netflix made this list on December 17, 2004… if you invested $1,000 at the time of our recommendation, you’d have $334,793!* Or when Nvidia made this list on April 15, 2005… if you invested $1,000 at the time of our recommendation, you’d have $1,257,420!*
Now, it’s worth noting Stock Advisor’s total average return is 874% — a market-crushing outperformance compared to 209% for the S&P 500. Don’t miss the latest top 10 list, available with Stock Advisor, and join an investing community built by individual investors for individual investors.
See the 10 stocks »
*Stock Advisor returns as of October 31, 2026.
David Dierking has no position in any of the stocks mentioned. The Motley Fool has no position in any of the stocks mentioned. The Motley Fool has a disclosure policy.