Key Points
-
The Nasdaq just suffered its biggest one-day drop since June 5.
-
Two Nasdaq corrections have already occurred in 2026.
-
Market volatility can accelerate at a moment’s notice.
-
The Nasdaq Composite (NASDAQINDEX: ^IXIC) fell 2.6% on Oct. 22, closing at 26,008.86 and marking the largest decline since a 4.2% drop on June 5.
Here’s the level that would put the Nasdaq in a correction, why corrections are occurring more frequently, and how you can prepare for volatility.
Missed Nvidia in 2009? This Rare Signal Is Flashing Again. In 2009, a “Double Down” signal flashed for a little-known chipmaker called Nvidia. For the first time in years, that same “Total Conviction” signal is flashing for a company 1/100th the size of Nvidia. Continue »
Nasdaq Correction territory is below 24,950
A correction is defined as a drop of at least 10% from the highs, and a bear market is a prolonged period of decline of at least 20% from the highs.
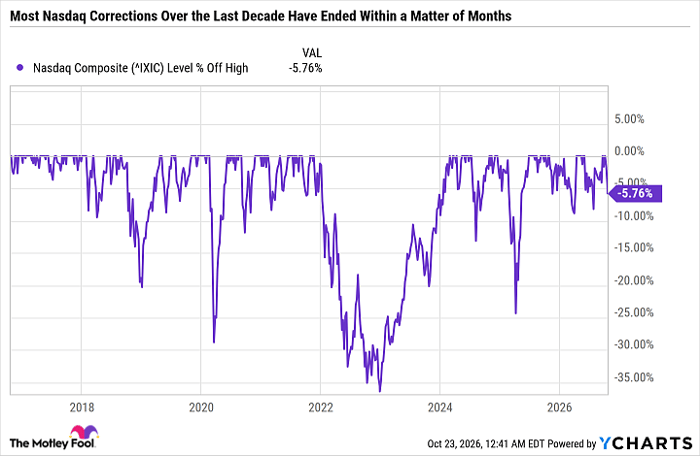
Based on the Oct. 22 close, the Nasdaq would need to drop an additional 4.1% to reach a correction. If that happens, it will mark the third correction this year. Although the last two corrections were brief.
Historically, stock market corrections have occurred every one to two years. Lately, they have been happening with increasing speed and frequency. However, the recoveries have also been swift.
^IXIC data by YCharts
As you can see in the chart, most declines of more than 10% in the Nasdaq over the last decade were fully recovered within a matter of months. In fact, the only prolonged downturn during that period was from early 2022 to early 2024.
Even with all that volatility, the Nasdaq has still produced an 83.5% total return over the last five years. So the simplest way to endure corrections is to hold positions in quality companies, index funds, and exchange-traded funds. That said, I’d expect the uptick in choppy market behavior to persist or even worsen in the years to come.
Expect more volatility
The U.S. stock market has become more prone to sharp declines that can drop like an elevator and recoveries that can snap back like a rubber band. There are two main reasons why investors should expect that to continue.
1. Accessible and actionable information
Information spreads like wildfire. And the ability to act on it has never been easier, from institutional high-frequency and algorithmic trading to artificial intelligence (AI)-driven trading to free trading on mobile apps like Robinhood.
The speed at which information gets disseminated creates knee-jerk reactions, making it more important than ever for investors to filter through the noise and stay grounded in fundamentals.
2. Index concentration
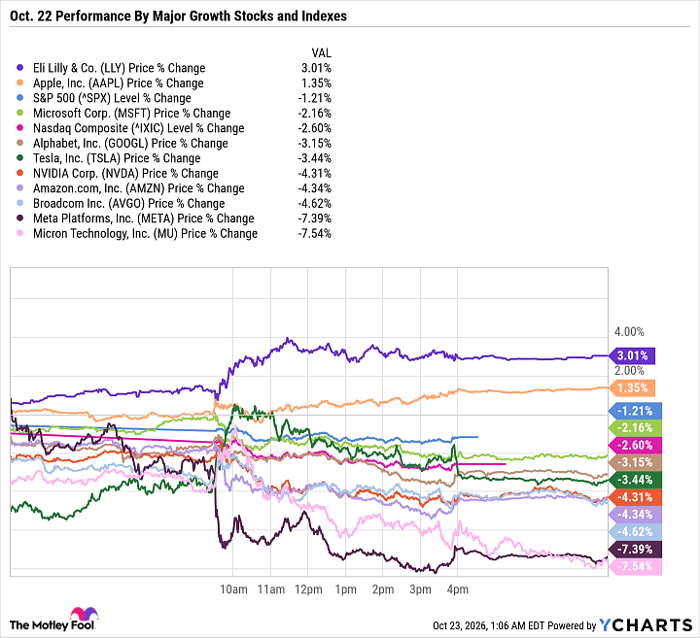
The second factor is that major U.S. stock market indexes include multiple highly influential mega-cap companies, many of which are directly related to AI. The U.S. is home to 16 of the world’s 20 most valuable companies. The tech sector, which doesn’t even include Alphabet, Meta Platforms, Amazon, or Tesla, makes up 39.7% of the S&P 500 (SNPINDEX: ^GSPC). And Nvidia, Apple, Alphabet, Microsoft, Amazon, Meta Platforms, Broadcom, Tesla, Eli Lilly, and Micron Technology make up 39.5% of the S&P 500. Here’s a look at how those ten stocks performed on the Oct. 22 sell-off.
LLY data by YCharts
With the exception of Eli Lilly and Apple, which gained during the session, the other eight largest S&P 500 growth stocks all fell by more than the S&P 500 on Oct. 22 — highlighting how concentration risks are amplified during sell-offs.
Invest in your best ideas
Thursday’s sell-off was a reminder of how swiftly the broader indexes can fall if sentiment or narratives change. For long-term investors, the lesson isn’t to rotate out of growth-focused sectors like tech and into defensive sectors, but rather to anchor their portfolios with high-conviction companies from a variety of sectors. That way, you can preserve independent thinking rather than letting the price that Mr. Market quotes on a given day overinfluence your decision-making.
Now is a good time to conduct a portfolio review and ensure your holdings match your risk tolerance. If your largest positions are all heavily correlated or have overlapping themes, then your portfolio may be more prone to sudden drops and pops than you’d like.
Should you buy stock in NASDAQ Composite Index right now?
Before you buy stock in NASDAQ Composite Index, consider this:
The Motley Fool Stock Advisor analyst team just identified what they believe are the 10 best stocks for investors to buy now… and NASDAQ Composite Index wasn’t one of them. The 10 stocks that made the cut could produce monster returns in the coming years.
Consider when Netflix made this list on December 17, 2004… if you invested $1,000 at the time of our recommendation, you’d have $355,124!* Or when Nvidia made this list on April 15, 2005… if you invested $1,000 at the time of our recommendation, you’d have $1,296,254!*
Now, it’s worth noting Stock Advisor’s total average return is 901% — a market-crushing outperformance compared to 210% for the S&P 500. Don’t miss the latest top 10 list, available with Stock Advisor, and join an investing community built by individual investors for individual investors.
See the 10 stocks »
*Stock Advisor returns as of October 24, 2026.
Daniel Foelber has positions in Broadcom and Nvidia. The Motley Fool has positions in and recommends Alphabet, Amazon, Apple, Broadcom, Eli Lilly, Meta Platforms, Micron Technology, Microsoft, Nvidia, and Tesla. The Motley Fool recommends Robinhood Markets. The Motley Fool has a disclosure policy.