Buckle up and hang on, because it’s been a challenging year on Wall Street. Since hitting its respective all-time high during the first week of January, the benchmark S&P 500 (SNPINDEX: ^GSPC) pulled back by as much as 24%. In fact, the widely followed index delivered its worst first-half to a year in more than a half-century.
It’s been even tougher sledding for the growth-dependent Nasdaq Composite (NASDAQINDEX: ^IXIC), which lost as much as 34% of its value since hitting its all-time intra-day high in mid-November. Because growth stocks largely led the market higher following the COVID-19 crash of February-March 2020, Wall Street and investors have been keeping a closer eye on the performance of the Nasdaq than in years’ past.
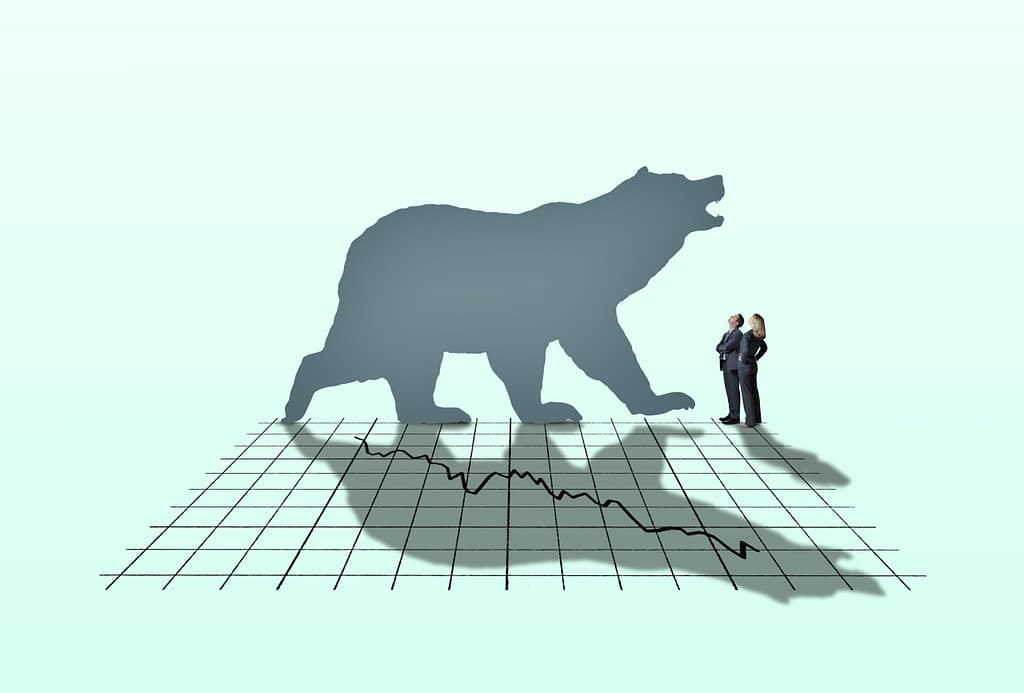
It’s led to the perhaps the most important question of all: How far could the Nasdaq Composite ultimately plunge? Based on history and a variety of data points, a roughly 50% decline that took the index to around 8,000 may well be in the cards.
Image source: Getty Images.
Margin debt is an ominous sign for growth stocks
Among the many warning signs that the Nasdaq’s tumble could be far from over is outstanding margin debt, which is published monthly by the Financial Industry Regulatory Authority (better known as FINRA). “Margin debt” being the amount of money borrowed, with interest, by investors to buy or short-sell securities.
Over long periods of time, it’s perfectly normal for the amount of margin debt outstanding to increase with the overall value of the stock market. What isn’t normal is when margin debt outstanding skyrockets over a short period of time. Although margin debt can magnify gains if an investor correctly chooses which direction a security will move, it can just as easily magnify losses and lead to a margin call — i.e., an instance where a lending broker requires additional collateral or the sale of assets.
Since 1995, there have been three instances where outstanding margin debt has climbed by more than 60% in a one-year time frame. It occurred between March 1999 and March 2000, which effectively marked the peak of the dot-com bubble. It happened again between June 2006 and June 2007, which was just months before the financial crisis took shape. Finally, it occurred between March 2020 and March 2021.
In the previous two instances where margin debt jumped by at least 60%, the S&P 500 lost 49% and 57% of its respective value. Expecting the Nasdaq to shed approximately half its value seems to be par for the course when margin debt soars.
Effective Federal Funds Rate data by YCharts.
Unprecedented Fed action is weighing on fast-paced companies
Another reason the growth-driven Nasdaq Composite could tumble all the way to 8,000 is the Federal Reserve’s hawkish monetary policy.
For more than a decade, the nation’s central bank has fostered a favorable growth environment for fast-paced companies. Lending rates remained near historic lows for years, providing growth stocks with easy access to cheap capital that they used to hire, acquire, and innovate. But times have changed, and Wall Street has entered uncharted territory.
In June, the Bureau of Labor Statistics reported a four-decade high 9.1% inflation rate in the United States. The pace at which prices are rising has locked the Fed into aggressive rate hikes. This alone is normally bad news for the stock market.
What makes this historically bad is that the nation’s central bank has never hiked rates into a declining stock market. Wall Street loves to lean on precedence to get some idea of how history might rhyme. But in this instance, there is no precedent to look back upon. Wall Street is just as much in the dark as to what could happen next as John and Jane Q. Investor.
To make matters worse, the Nasdaq Composite has already shed as much as 34% of its value, and the Fed hasn’t really even begun paring down its balance sheet as of yet. Although the Fed announced that quantitative tightening (QT) would begin in June 2022, only a minimal amount of combined Treasury bonds and mortgage-backed securities have been reduced from its balance sheet. Once liquidity begins to dry up and QT really gets underway, growth stocks could be in serious trouble.
Image source: Getty Images.
Earnings deterioration will likely accelerate in the third quarter
A third reason the Nasdaq could eventually lose around half of its value and hit the 8,000 mark is the growing likelihood of corporate earnings deterioration.
Think about this for a moment: The U.S. economy unexpectedly shifted into reverse during the first quarter, yielding a gross domestic product (GDP) drop of 1.6%. Meanwhile, the Atlanta Federal Reserve’s GDPNow forecast for the second quarter continues to deteriorate. After spending much of the second quarter (Q2) expecting positive GDP growth, the Atlanta Fed’s GDPNow estimate for Q2, as of July 19, was for a decline of 1.6%. If this estimate proves accurate, we’d be looking at back-to-back quarters of negative 1.6% GDP growth, and the certainty that the U.S. economy has been a recession since the curtain opened on 2022.
Even if the U.S. economy avoids a recession, corporate earnings have shown plenty of signs of weakness. Among the few companies that have reported their second-quarter or calendar second-quarter operating results, most have seen their third-quarter estimates come in shy of Wall Street’s expectations, or get reduced by analysts shortly after their report. In other words, while stocks might seem modestly cheap now, the “e” component of the price-to-earnings ratio could change dramatically in the coming months.
And if weaker corporate spending wasn’t enough to sound the alarm, don’t forget about the effects of foreign currency movements on multinational businesses. With the U.S. Dollar Index hitting a two-decade high, businesses with substantive operations in foreign markets could see their revenue come in as much as 5% to 10% below expectations.
The Nasdaq and S&P 500 have firmly shook off all previous corrections and bear markets. ^IXIC data by YCharts.
Investing in a bear market has its silver linings
Admittedly, the picture I’ve painted above probably doesn’t sound all that appealing — especially if you’re invested heavily in innovative growth stocks. But bear market declines do have their silver linings.
To start with, every bear market and stock market correction throughout history has proved to be a rock-solid buying opportunity for patient investors. Eventually, every notable decline in the major U.S. indexes, which includes the Nasdaq, has been wiped away by a bull market. When you buy into the stock(s) you like often matters far less than how long you allow your investment thesis to play out.
For instance, data from Crestmont Research has shown that buying and holding an S&P 500 tracking index for 20 years has been a foolproof way to make money in the stock market. Crestmont examined the rolling 20-year total returns, including dividends, of the S&P 500 for 103 ending years between 1919 and 2021. The result was a positive return for all 103 rolling 20-year periods, with a double-digit average annual total return in over 40% of these end years.
Something else you might not realize is that growth stocks have a knack for outperforming during periods of economic weakness. In 2016, Bank of America/Merrill Lynch released a report that examined the extremely long-term performance of growth stocks versus value stocks. While value stocks handily outpaced growth stocks over the 90-year period that was studied (1926-2015), it was growth stocks that outperformed value stocks during and immediately following economic slowdowns. This suggests the Nasdaq Composite and its components could bounce back in a big way sooner than later.
Investors should also understand that there’s no foolproof method of predicting when bear markets will occur, how long they’ll last, or how steep the decline will be. While a reasonable case can be made for the Nasdaq to reach 8,000, this is ultimately nothing more than a guess based on the data available.
Since we don’t know precisely what’ll happen next, dollar-cost averaging into your favorite stocks can be a particularly smart move. Dollar-cost averaging involves buying stocks at regular time intervals, regardless of how well or poorly the broader market is performing. It’s a way to remove some of the emotional aspects of investing, and you won’t be kicking yourself over market timing.
10 stocks we like better than Walmart
When our award-winning analyst team has an investing tip, it can pay to listen. After all, the newsletter they have run for over a decade, Motley Fool Stock Advisor, has tripled the market.*
They just revealed what they believe are the ten best stocks for investors to buy right now… and Walmart wasn’t one of them! That’s right — they think these 10 stocks are even better buys.
Stock Advisor returns as of 2/14/21
Bank of America is an advertising partner of The Ascent, a Motley Fool company. Sean Williams has positions in Bank of America. The Motley Fool has no position in any of the stocks mentioned. The Motley Fool has a disclosure policy.